
What are Learner Attainment Reports and how do you use them?
What is the Learner Attainment Report?
The Learner Attainment Report shows you how well your learners are achieving the learning outcomes you've defined for your course. Not just what grades they earned, but what they actually learned.
Grades tell you that a learner scored 78% overall. They don't tell you whether that learner can apply basic navigation or describe key platform features. The Learner Attainment Report answers that second question, which are the learning outcomes. It takes the assessments you've mapped to learning outcomes and reports learner performance outcome by outcome, for individual learners and for your class as a whole.
How to generate the report
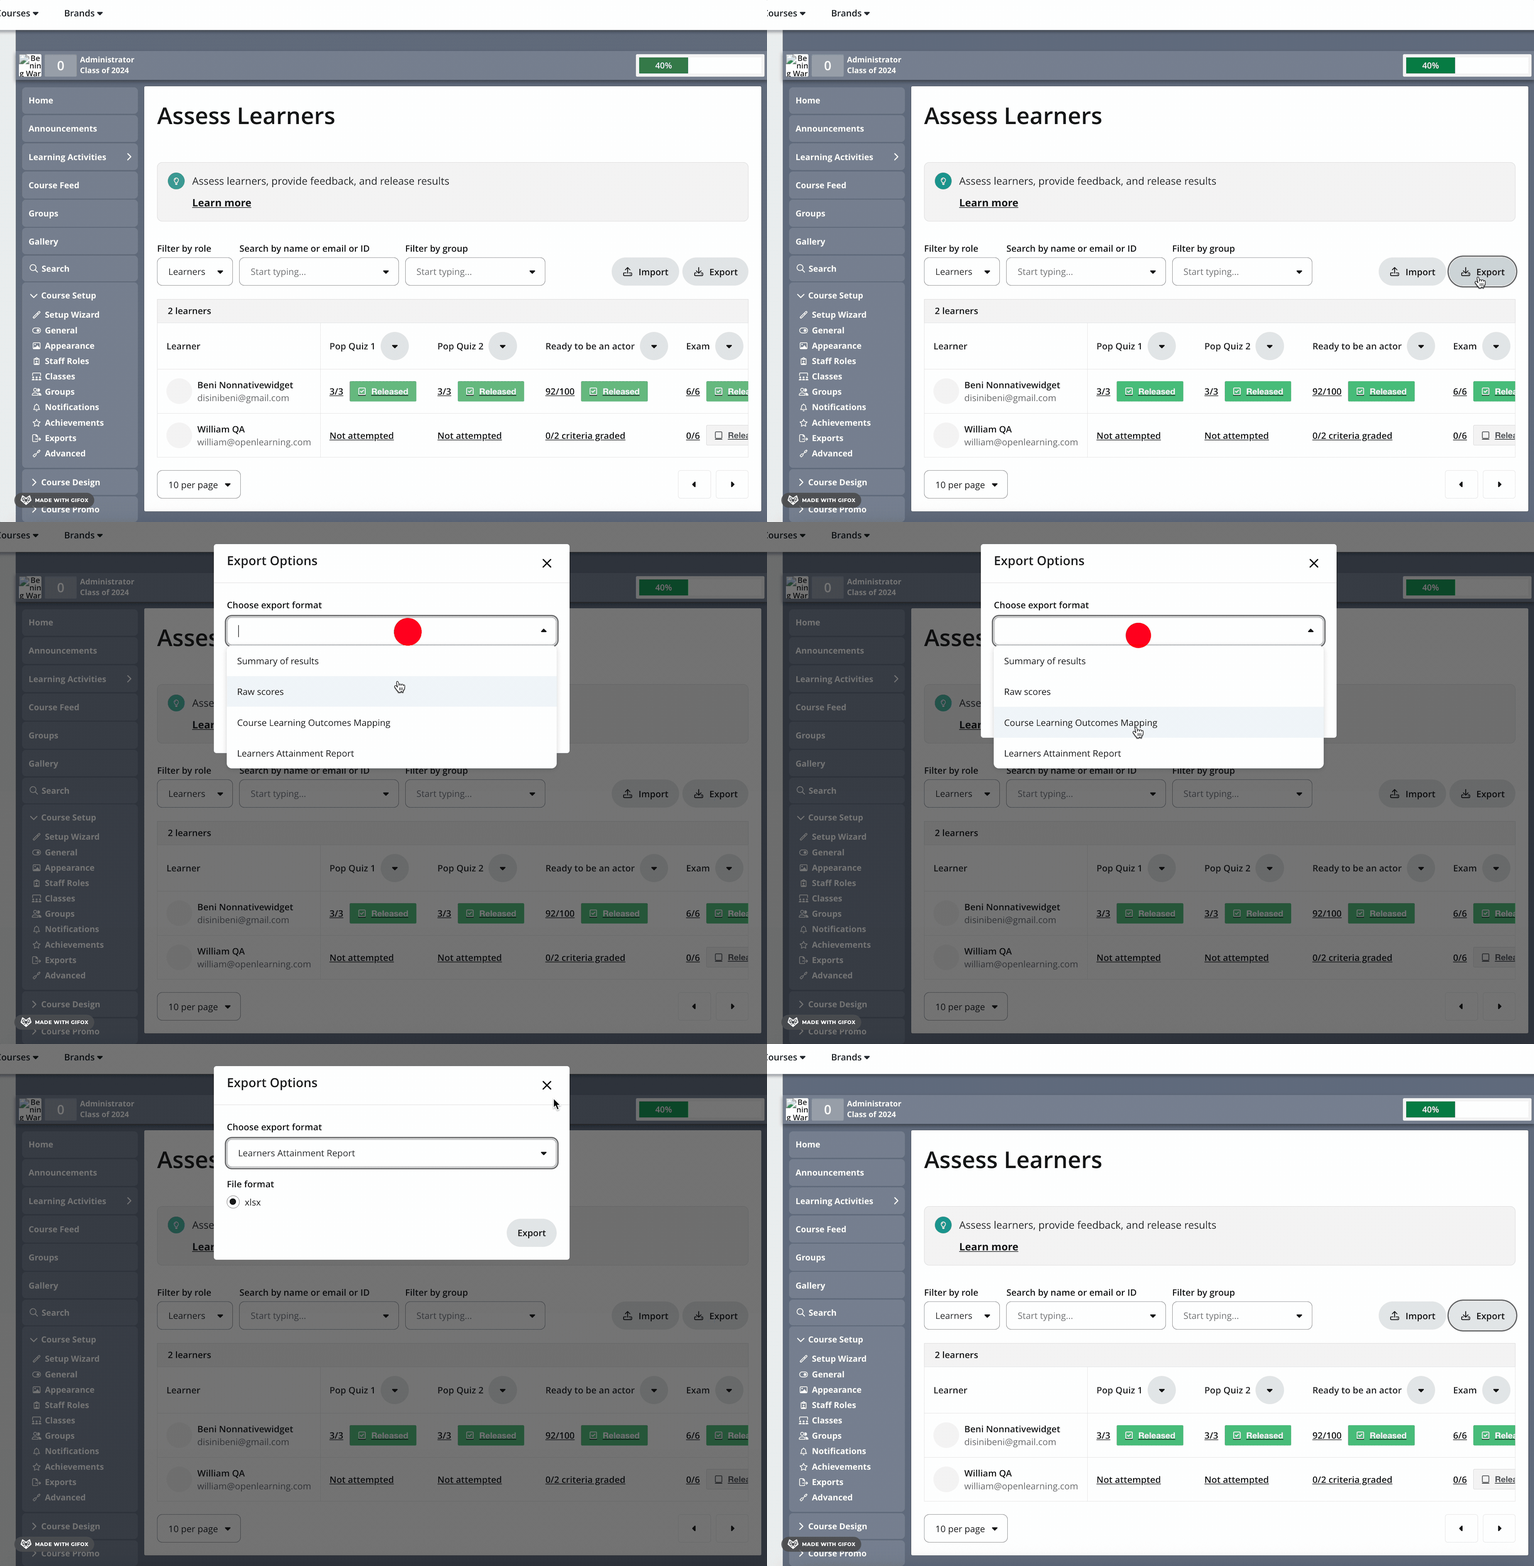
To export Learners Attainment Report, go to Assess Learners page > click the Export button above the table > select Learners Attainment Report from the dropdown selection.
How it works
The report is built from the connections you've already made between your assessments and your learning outcomes. Attached in this help document is a Learners Attainment Reports that we can use as an example.
1. Assessments are made of components. A grade item (a quiz, an exam, etc) is made up of individual components, usually questions. The Welcome Quiz might have 5 multiple-choice questions; the Final Exam might have 3 questions.
2. Components are mapped to learning outcomes. Outcomes are attached at the component level, not the assessment level. Question 2 of your quiz is mapped to one outcome; question 5 might be mapped to another. This is what makes outcome reporting possible. A single assessment might cover several outcomes, or just one.
3. Each component's score converts to course points. Every component carries a share of its grade item's weight:
(Component score ÷ Grade item's raw total) × Grade item weight = Course points4. Learners complete the assessments. As learners submit their work and receive scores, those scores become the raw evidence for the report.
5. Points are credited to the mapped outcome. Each component's points are attributed to whichever outcome it's mapped to. Add up all the points credited to an outcome, and you have that learner's attainment for it.
6. The report calculates attainment per outcome. For each learning outcome, the report gathers every piece of outcome-mapped assessment evidence, applies the relevant assessment weights, and produces an attainment figure. It does this for each learner individually, and then aggregates across the class. If a question isn't linked to a learning outcome, it doesn't appear in this report because it's not an evidence of outcome attainment.
A worked example
Please see the attached report that has three grade items:
- Welcome Quiz — 5 multiple-choice questions, 1 point each, weighted 20%
- Final Exam — 3 multiple-choice questions, 1 point each, weighted 50%
- Event Planning Mastery — a pass/fail outcomes report worth 100 points, weighted 30%
Each component is worth a fixed share of course points:
- Each quiz question:
(1 ÷ 5) × 20 =4 course points - Each exam question:
(1 ÷ 3) × 50 =16.67 course points - The Event Planning pass:
(100 ÷ 100) × 30 =30 course points
Our learner, Beni, scores 4/5 on the quiz, 2/3 on the exam, and passes Event Planning.
Her grade is the sum of her course points:
(4 × 4) + (2 × 16.67) + 30
= 16 + 33.33 + 30
= 79.33
Her attainment report takes those same points and groups them by the outcome each question was mapped to:
analyse-christmas-timeline-tasks — quiz Q2, Q3, Q4; exam Q3; Event Planning:
Q2 correct      →   4
Q3 correct      →   4
Q4 incorrect    →   0
Exam Q3 wrong   →   0
Event Planning  →  30
                  ────
                    38
analyse-decoration-themes — quiz Q5; exam Q1:
Q5 correct      →   4
Exam Q1 correct →  16.67
                  ───────
                    20.67
evaluate-christmas-budgeting-strategies — quiz Q1; exam Q2:
Q1 correct      →   4
Exam Q2 correct →  16.67
                  ───────
                    20.67
And the outcomes sum back to the grade:
38 + 20.67 + 20.67 = 79.33The report's Total for course is 79.33 — identical to her grade. Nothing was lost; the points were simply re-sorted.
Why your report total might NOT match the grade
The example above works out perfectly because every question in that course is mapped to a learning outcome. That's the ideal case. In practice, many courses aren't fully mapped and that's where the two numbers come apart.
The cause: unmapped components
A question that isn't mapped to any outcome still counts toward the learner's grade. Learners answered it, they earned points for it, and those points belong in their result.
But that same question cannot count toward outcome attainment — because there's no outcome for it to be evidence of. The report has nowhere to put those points.
So unmapped components create a gap:
Grade  =  points from ALL components
Report =  points from MAPPED components only
Whenever the report total is lower than the grade, unmapped components are the reason.
A worked example of the gap
Take the same Welcome Quiz — 5 questions, weight 20%, each question worth 4 course points. But this time, only three of the five questions are mapped to outcomes. Questions 4 and 5 have no CLO attached.
Beni answers Q1, Q2, Q3 and Q5 correctly; she gets Q4 wrong.
Her grade counts all four correct answers:
Q1 ✓ (4) + Q2 ✓ (4) + Q3 ✓ (4) + Q4 ✗ (0) + Q5 ✓ (4) = 16 pointsHer attainment report can only count the mapped ones:
Q1 ✓ mapped   (4)
Q2 ✓ mapped   (4)
Q3 ✓ mapped   (4)
Q4 ✗ mapped   (0)
Q5 ✓ UNMAPPED (—)  ← earns grade points, but no outcome to credit
                ────
                  12 points
Beni earns 16 grade points from the quiz, but only 12 flow into the attainment report. The missing 4 points are Q5 — a question she answered correctly, that contributes to her grade, but that isn't evidence for any outcome because nobody mapped it.
Multiply that across a whole course and the gap can be substantial.
What this means for you
The gap is not a bug, it's a signal. A report total that falls well short of the grade is telling you that a meaningful portion of your assessment content isn't linked to your learning outcomes. For accreditation purposes, that's worth knowing: it means you have assessment activity that isn't demonstrating outcome achievement.
How to close the gap: review your assessments and map every question to a learning outcome. The more complete your mapping, the more of your assessment evidence flows into the report — and the closer your report total will come to the learner's grade.
Diagnostic rule: If your Attainment Report total equals the grade, your course is fully mapped. If it's lower, some components are unmapped. The size of the gap tells you roughly how much.
Reading the report
- Grade item: a quiz, exam, or other assessable item from your gradebook. Each heads a block of columns.
- Grade item weight: what that item is worth toward the course total. These sum to 100 across your course.
- Component: an individual question inside a grade item. This is the level outcomes are mapped at.
- Mapped CLOs: the learning outcome each component is linked to. A blank here means the component is unmapped and won't appear in the attainment figures.
- Component weight: the raw point value of each component within its grade item.
- Total per component weight: the learner's raw score on each component, with a raw total per grade item. These match what you see in Assess Learners (e.g. 4/5, 2/3).
- Total for course: the learner's total weighted score. In a fully mapped course, this equals their grade.
- CLO breakdown: the same course points, regrouped by learning outcome. This is the core output.
- Class summary: three aggregate rows across all learners:
- Average: mean attainment per outcome across the class
- Max achievable: the highest score possible for that outcome, given the components mapped to it
- Average as a %: the class average as a percentage of what was achievable. This is usually the figure you'll want for accreditation.
FAQ
1. Why is the score in the report lower than the learner's grade?
Because the report only counts assessment content mapped to a learning outcome. Anything unmapped is excluded, so there's a possibilty that the figure might be lower than the full grade.
2. Which number is the learner's "real" grade?
Use The Assess Learners view/table or the Summary of results report. The Attainment Report is an outcomes measurement tool.
3. The "Total" on a row looks like a raw score, but the course total looks weighted. Why?
Every figure in the report, each row total and the course total, is calculated by applying weights to the outcome-mapped portion of the assessment. The report is internally consistent. It just isn't consistent with the grade view, because it's scoped to outcomes rather than full scores.
4. How can I increase attainment scores in the report?
Map more of your assessment content to learning outcomes. The more of an assessment that's linked to outcomes, the more of its score becomes outcome evidence.